Creating a Bluesky Labeler From Scratch
When using Bluesky, I was tired of seeing a certain class of topics, so I developed and deployed a "labeler". This labeler ingests approximately 50 posts per second and hundreds of other events, categorizing posts based on configured topics and labeling them accordingly.
💡 This article and the described project were written without the need of an LLM.
What is a Bluesky labeler?
Bluesky is a social media network similar to X/Twitter, built on an open network called "ATProto". Independent developers can create labelers, to which users can subscribe to hide the labeled posts.
Labelers can be used to hide NSFW posts, warn against misinformation, or hide certain topics. My labeler's goal is to hide posts with the topic of US legislation, since this topic is of little interest to most international users.
Goals
The labeler I wanted to design had to be able to categorize the configured topic, with the additional goals of:
- Keep false positives close to zero: Accidentally hiding an unrelated post is worse than letting a topic-related post sneak by unlabeled. In other words, precision is prioritized over recall.
- The software has to run unattended for long periods of time, i.e. for several months.
- It has to be performant and efficient enough to be cheap and simple to host.
Design
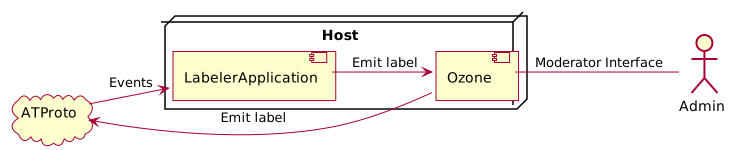
The labeler application ingests post-related events (i.e. post creation, update, and deletion). Emitting the label events directly on the ATProto network requires some complicated API, so instead I host an instance of "Ozone", a first-party moderation software developed by Bluesky. It has a modest resource usage and an easy to follow deployment guide, so using it decreases the development complexity. The labeler application sends label events to Ozone, and Ozone communicates them to the ATProto network. As an added bonus, Ozone comes with a fully featured moderation interface, allowing me to review manual reports and manually apply labels easily.
My choice of programming language for this project is Elixir. It is designed for soft real-time systems with a focus on fault tolerance, so it is very suitable for my use case.
My first plan was to use a small LLM to classify the posts based on the topic. I thought a 1B model should be good enough. Even with a small model, it would be impossible to run inference on every post, as there are approximately 50 posts per second on the network. Therefore I decided to analyze only the posts that have received over 50 likes.
The flow is as follows:
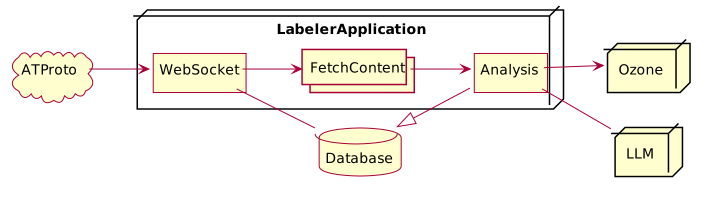
Each post received is stored on the database. Only its ID and creation time are stored; the contents are discarded to save space. Every received like event increments the post's like counter in the database. When the count hits the threshold, the post content is fetched via an HTTP call, analyzed, potentially labeled, and finally deleted from the database.
I implemented this flow using the GenStage library. Each stage is isolated for errors, and provides backpressure to each other.
- WebSocket stage: This stage connects to the ATProto websocket API, writing to the database and emitting posts that crossed the threshold to the next stage. (I should also note that I developed the underlying websocket library too, partly because I was not satisfied with the existing libraries, but mainly because it was fun.)
- FetchContent stage: Multiple instances of this stage run at the same time. Each instance queues up received events, then makes HTTP requests in batches. The received post contents are then passed to the next stage.
- Analysis stage: Analyzes, maybe emits label, then deletes the row. It may seem that this stage has too many responsibilities, but stages are designed for runtime needs; separation of concerns happens at the code organization level. Each step within this stage is naturally implemented in different modules; the code for the stage simply calls into the modules through plain function calls, serializing the operations.
I implemented the code, deployed on a VPS, and started testing the labeler. Initial results were not great; there were too many false negatives as well as a measurable amount of false positives. I tried refining the LLM prompt, adding more cases it should cover, when I realized that instead of adding more text to an LLM prompt, I could simply create a list of regexes: Posts would be categorized based on whether any of the regexes match. This would mean writing a list of regexes by hand, but that list would not be larger than the size of the prompt. The maintenance effort required to keep the regex list up to date with recent news would be the same as keeping the prompt up to date as well.
Switching from an LLM to a regex list had multiple benefits:
- It was immediately clear why a post is labeled or not.
- Much lower cost: Where an LLM inference takes 1-2 seconds, a regex resolves
in microseconds. This let me downsize the server to one of the smallest
size VPSs. I could also analyze every single post rather than only the ones
with a minimum of 50 likes.
- Since Bluesky puts a limit of 50,000 labels per day and I would otherwise label ~200,000, I still had to retain a threshold of ~6 likes to keep the number below the hard limit.
- Much fewer false positives and a similar rate of accuracy.
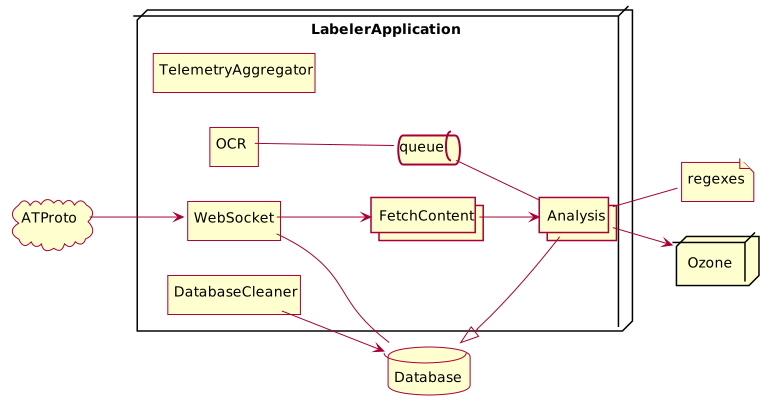
The regexes are read from a file. Whenever the file is modified, it is automatically reloaded, so I can change the regex rules without interrupting the application.
I will not go into detail here, but in order to read the text off screenshot images, I included an OCR component too.
Database maintenance
Since the database would grow unbounded over time, I wrote a database cleaning
job inside the application that periodically deletes older rows.
This could be most efficiently done by partitioning the posts table
according to post creation time, and dropping the older partitions. Instead,
I first implemented the simple method of executing a DELETE statement.
It takes about 30 seconds for Postgres to execute and puts some more load on
autovacuuming, but this does not affect anything in practice, so I chose to
keep the simpler implementation.
Monitoring and observability
I added a large number of telemetry emissions throughout the codebase.
The emitted telemetry events are aggregated within the application, and reported
to a Prometheus instance.
The prometheus-node-exporter application provides host related telemetry
(CPU, memory, etc.) to the Prometheus instance.
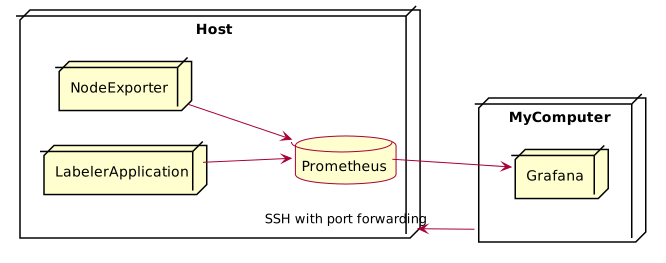
I have Grafana running on my local machine (instead of on the server host, for performance reasons). I can forward the relevant port via SSH, and then I can use Grafana to view the telemetry data on a dashboard.
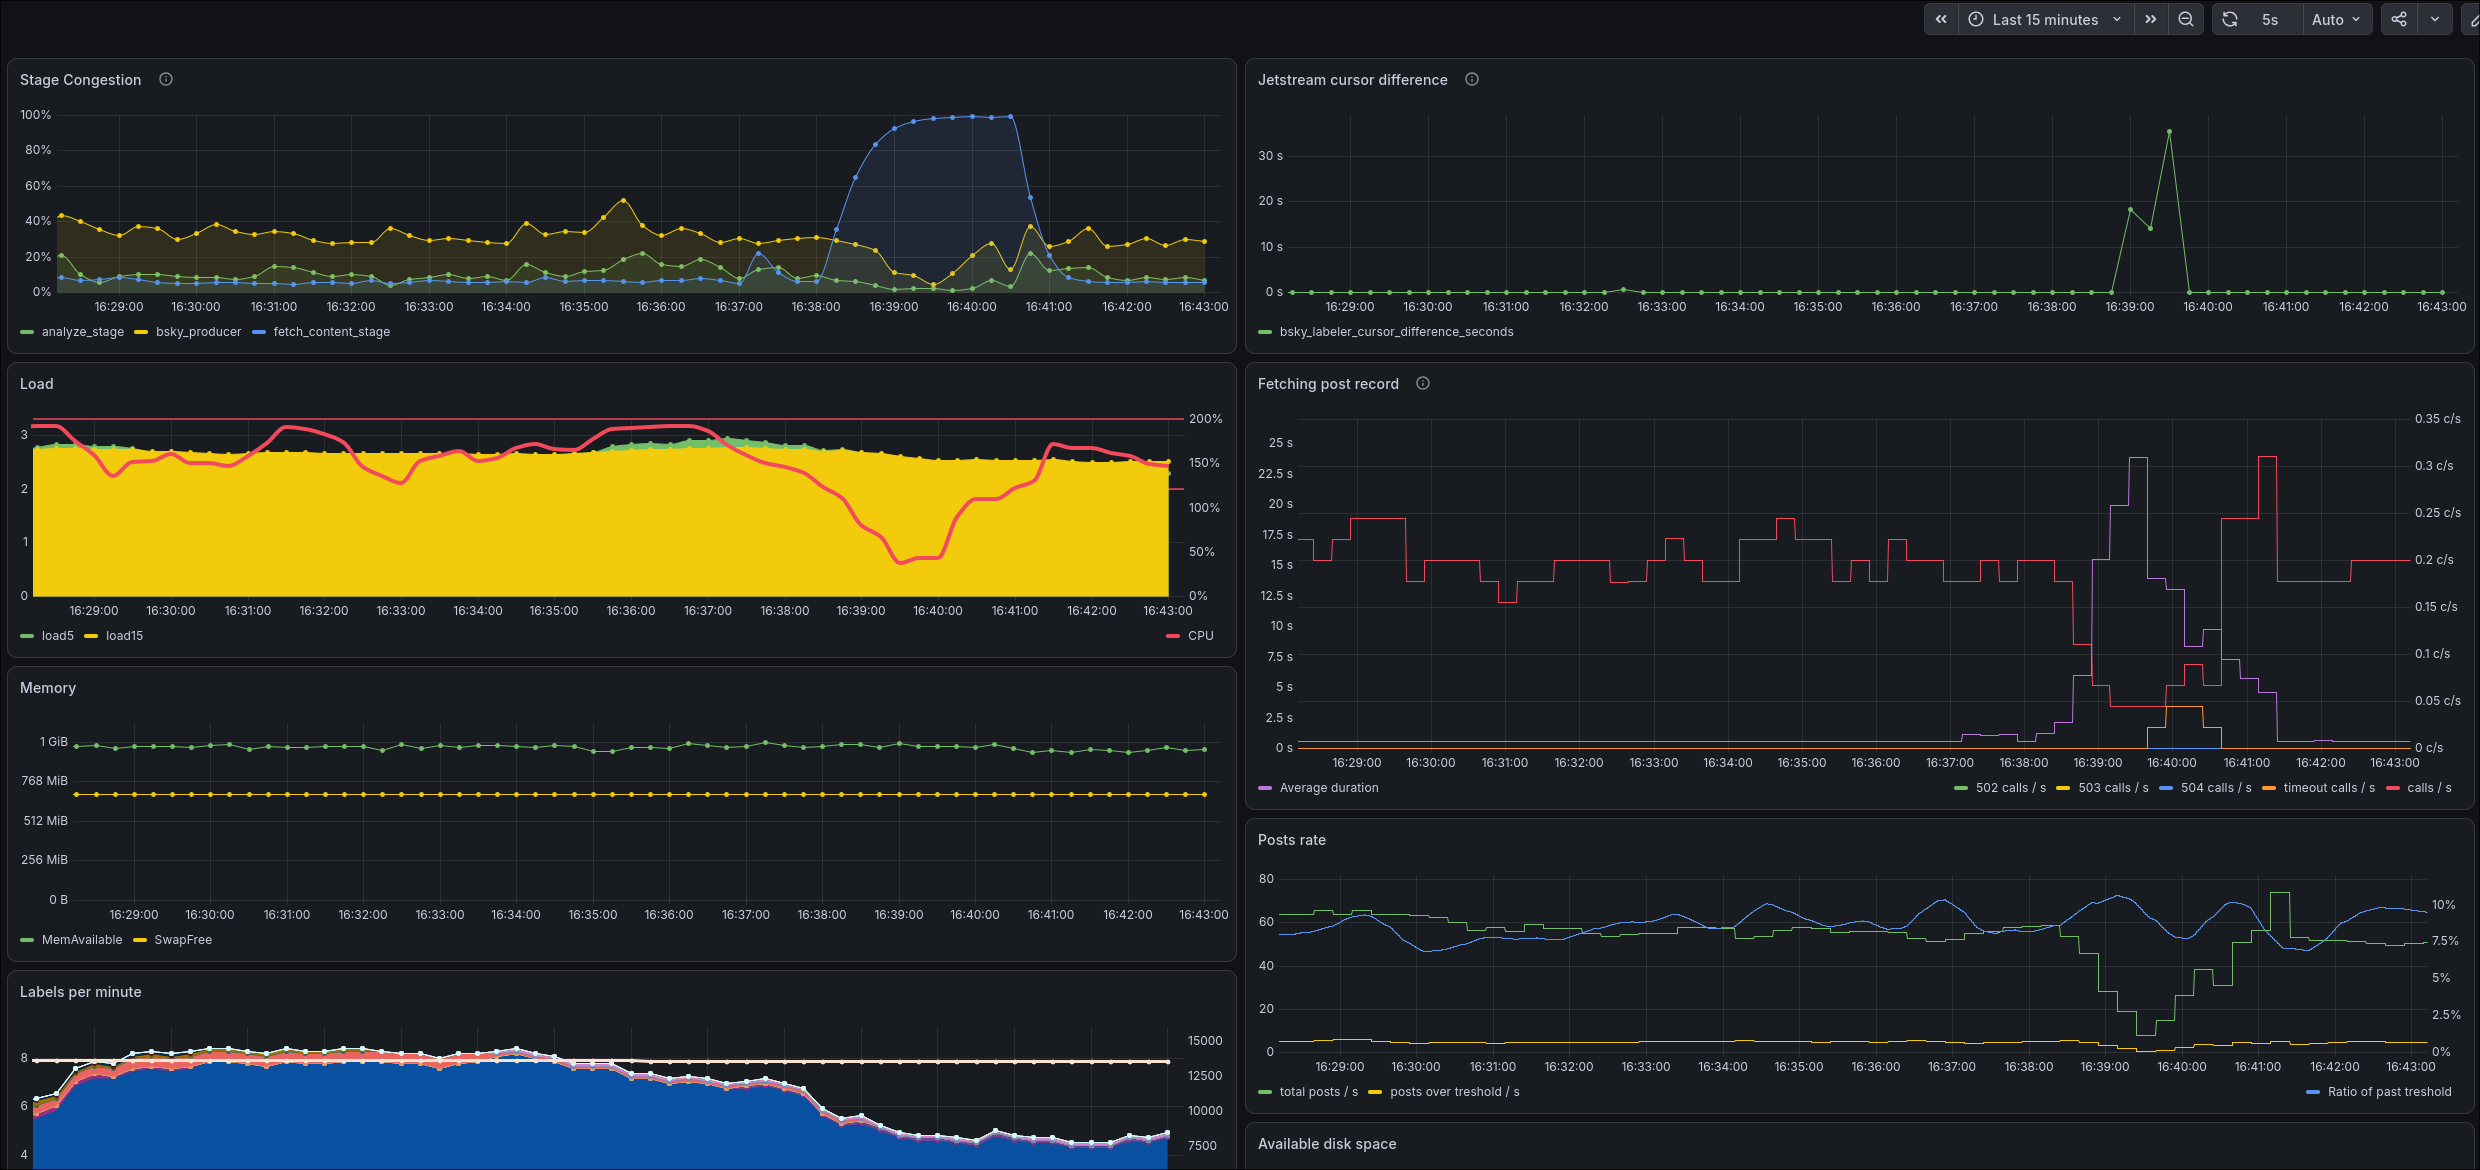
Using the dashboard, I can see at a glance whether everything is working correctly. (It also looks pretty. They say you should only include actionable metrics on your dashboard, but I like having a deeper insight. And stakeholders love graphs too.)
Deployment
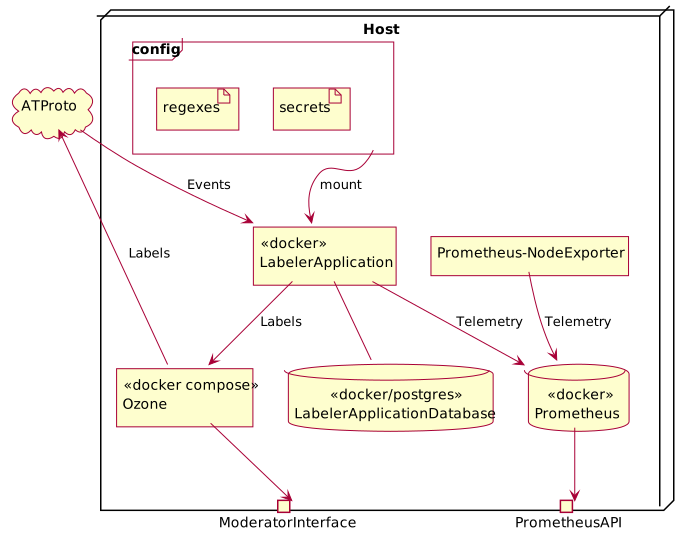
The application and its requirements are deployed as Docker containers. The deployment scripts and the configuration are kept in a separate git repository.
The secrets file is mounted at /run/secrets, which the application reads
at startup.
The LabelerApplication Docker image is uploaded to a locally hosted Docker registry and accessed using an SSH tunnel.
All in all, this project has been running with near zero manual intervention for more than 6 months, and a number of people have subscribed to the labeler; I am very content with how it turned out.
You can find the source code here: